一文带你了解Windows 性能监控系统的使用
我们现实工作中很多时候想知道当前服务器的各项性能指标,比如说CPU的使用率是多少,还有多少内存,各个磁盘的IO是什么样的情况等等。假如我们使用的是windows操作系统,那么它其实已经内置了一个很强的性能监控系统,本文就来介绍一下我们如何使用这个性能监控系统。
Windows Performance counter系统介绍
总得来说Windows performance counter系统是由这几个方面组成的:Consumer,provider,countersets,counters,instances以及counter value组成。
- 所谓的Consumer其实就是使用performance数据的模块,我们下面介绍的GUI和代码都属于这部分。
- Provider是指产生和publish性能数据的部分。它可以把数据publish给不同的countersets。
- Counterset就是一个group,它可以包含一个或多个counters,它会返回多个instance。
- Counter就是一个性能的定义,它有一个名字和类型。比如磁盘每秒写IO。
- Instance是性能数据的entity,可以包含一个或多个counter值。我们可以这样理解,假设我们是看磁盘的信息,磁盘的每秒的写IO就是一个counter,然后每个磁盘就是一个instance,它可以包含每秒写IO的counter,也可以包含每秒读IO的counter。
- Counter value就比较直观了,就是counter的值。
一般来说,Consumer会定期从provider的counterset中收集并记录数据。下面是一个简单的性能API架构图
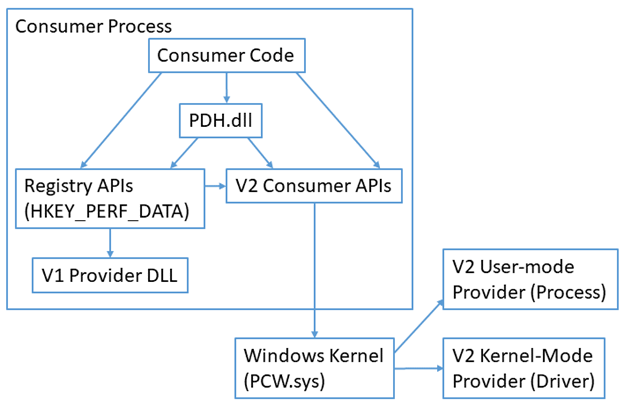
总得来说V1的架构已经要废弃了,大家尽量还是用V2的架构。
Performance Monitor GUI
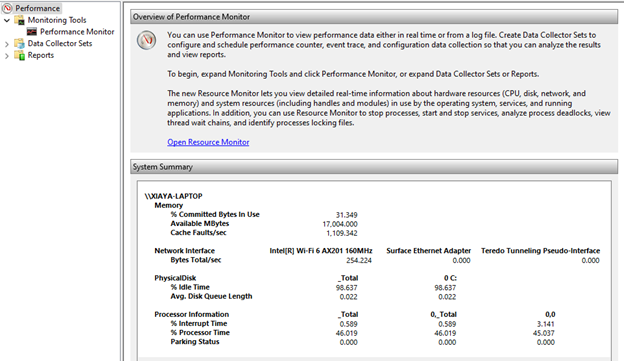
我们可以在开始菜单打开Performance Monitor界面,如下图所示,我们可以看到在右边其实有一个系统的总体情况的信息,它包括内存使用的情况,网络的传输状况,磁盘的一些简单信息和各个process的整体信息。这是一个实时的显示。
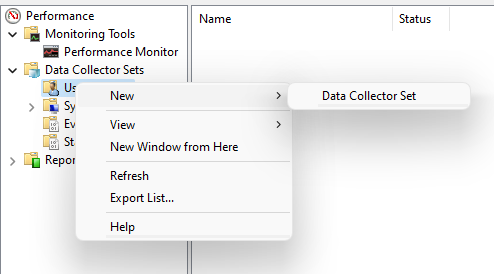
那么我们如何来真正使用这个工具呢?我们可以在左边Data Collector Sets中点击User Defined,然后创建你关心的Countset,
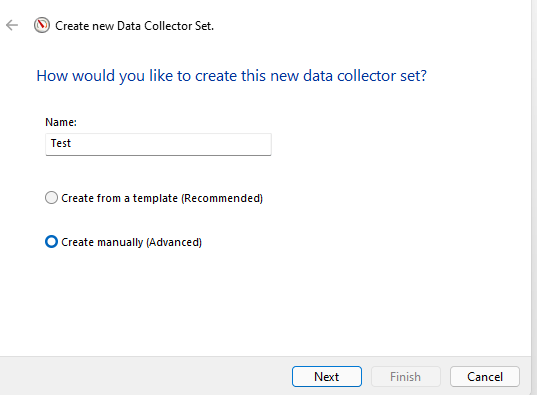
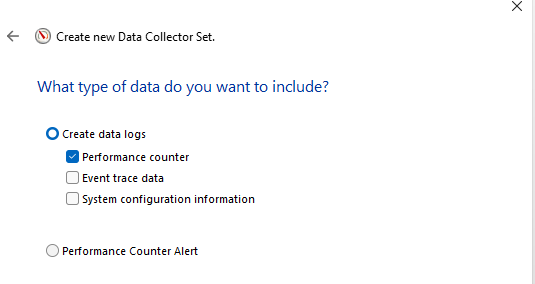
这里我们使用Create Manually来创建我们关心的Data Collector Set
这里选择Performance Counter
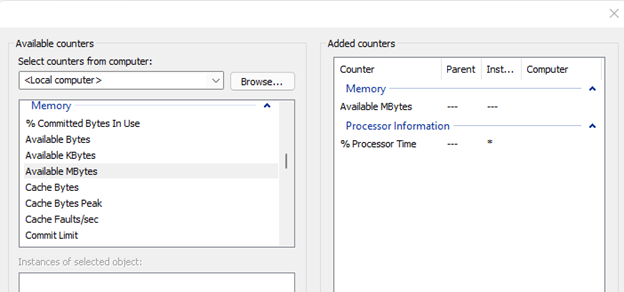
然后点击Add加入我们关心的performance Count,我们这里加入一个Process的%Process Time以及Memory中的Available Mbytes两个performance Count
并且把Sample Interval设为1 second,这个地方你可以根据你的监测时间来进行设置,一般来说,在现实的prod环境中,我们可能设置5分钟的间隔就足够我们分析出问题的时候系统总体状况了。下面设置一下你想把log保存的目录。这个目录一般我们会有一个script来及时把它上传到对应的log系统中以供我们分析。
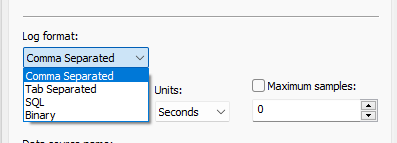
然后右击我们刚刚创建的Data collector set就可以start了,start之后可以看到具体的目录位置,这里我们可以右击属性,然后修改log的format到不同的格式,默认是binary,我们这里修改成comma separate:
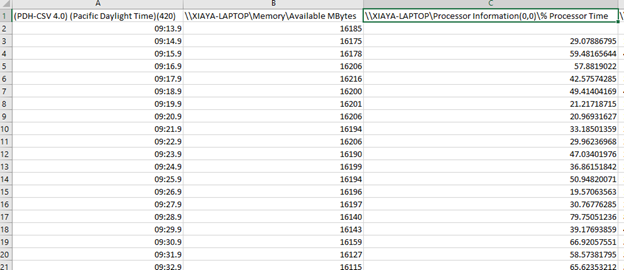
这样一来相关的数据就被记录到对应的文件中了,有了这些原始数据,你想做任何的性能分析都是小菜一碟了。
使用Performance Counter class进行.NET的编程
上面我们介绍了系统提供的各种Performance Counter,假如我们想要监控一个自定义的Performance Count怎么办呢,这里就来详细介绍一下如何在.NET的情况下创建一个自定义的performance Count。当然你也可以用代码来记录上面提到的predefine的performance count,只是不需要再进行创建即可。
- 首先来创建对应的data collection,首先是创建performance count的分类,这里我们取名为PerformanceCountExample,同时在其中创建两个count,分别是AverageCount和AverageCountBase。相关的代码如下:
private static bool SetupCategory()
        {
            if (!PerformanceCounterCategory.Exists("PerformanceCountExample"))
            {
                CounterCreationDataCollection counterDataCollection = new CounterCreationDataCollection();

                // Add the counter.
                CounterCreationData averageCount64 = new CounterCreationData();
                averageCount64.CounterType = PerformanceCounterType.AverageCount64;
                averageCount64.CounterName = "AverageCount";
                counterDataCollection.Add(averageCount64);

                // Add the base counter.
                CounterCreationData averageCount64Base = new CounterCreationData();
                averageCount64Base.CounterType = PerformanceCounterType.AverageBase;
                averageCount64Base.CounterName = "AverageCountBase";
                counterDataCollection.Add(averageCount64Base);

                // Create the category.
                PerformanceCounterCategory.Create("PerformanceCountExample",
                    "Demonstrates usage of the performance counter type.",
                    PerformanceCounterCategoryType.SingleInstance, counterDataCollection);

                return (true);
            }
            else
            {
                Console.WriteLine("Category exists - PerformanceCountExample");
                return (false);
            }
        }
创建对应的PerformanceCounter,这里我们分别创建了avgCounter和avgCounterBase,具体的代码如下所示:
        private static void CreateCounters()
        {
            // Create the counters.

            avgCounter = new PerformanceCounter("AverageCounter64SampleCategory",
                "AverageCounter64Sample",
                false);


            avgCounterBase = new PerformanceCounter("AverageCounter64SampleCategory",
                "AverageCounter64SampleBase",
                false);

            avgCounter.RawValue = 0;
            avgCounterBase.RawValue = 0;
        }
下面我们来模拟一些代码用来修改这些performance count
private static void CollectSamples(ArrayList samplesList)
{
Random r = new Random(DateTime.Now.Millisecond);
// Loop for the samples.
for (int j = 0; j < 100; j++)
{
int value = r.Next(1, 10);
Console.Write(j + " = " + value);
avgCounter.IncrementBy(value);
avgCounterBase.Increment();
if ((j % 10) == 9)
{
OutputSample(avgCounterBase.NextSample());
samplesList.Add(avgCounter.NextSample());
}
else
{
Console.WriteLine();
}
System.Threading.Thread.Sleep(50);
}
}
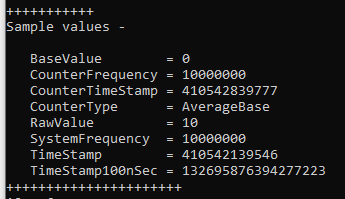
private static void OutputSample(CounterSample s)
{
Console.WriteLine("\r\n+++++++++++");
Console.WriteLine("Sample values - \r\n");
Console.WriteLine(" BaseValue = " + s.BaseValue);
Console.WriteLine(" CounterFrequency = " + s.CounterFrequency);
Console.WriteLine(" CounterTimeStamp = " + s.CounterTimeStamp);
Console.WriteLine(" CounterType = " + s.CounterType);
Console.WriteLine(" RawValue = " + s.RawValue);
Console.WriteLine(" SystemFrequency = " + s.SystemFrequency);
Console.WriteLine(" TimeStamp = " + s.TimeStamp);
Console.WriteLine(" TimeStamp100nSec = " + s.TimeStamp100nSec);
Console.WriteLine("++++++++++++++++++++++");
}
最后我们可以在main函数中进行调用了:
            if (SetupCategory())
                return;
            CreateCounters();
            CollectSamples(samplesList);
这个时候我们运行相应代码之后就可以看到对应的perfcount信息了,需要注意的是代码需要在Admin的情况下运行:
总结
本文简单全面总结了Windows中performance counter的使用方法,从理论,GUI以及代码实例三个方面详细介绍了相关内容,希望对大家有所帮助。


1 Response
[…] Widows性能监控实现的文章:《一文带你了解Windows 性能监控系统的使用》 […]