用Python实现一个决策树分类器
本文将会介绍如何用Python实现一个决策树分类器。主要包含下面两个方面:
- 什么是决策树?
- 使用Python实现决策树
什么是决策树
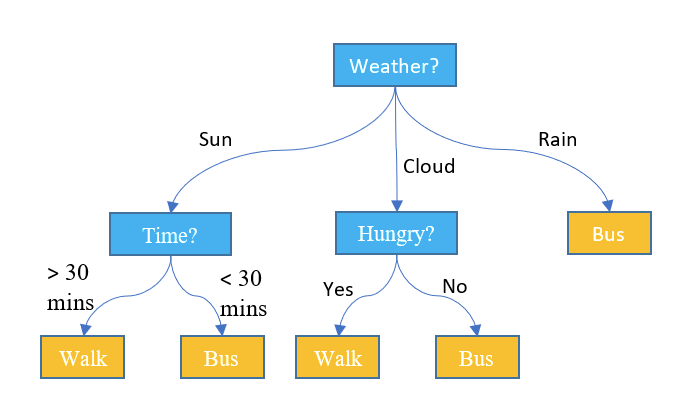
简单来说,决策树算法把数据按照树的结构分成了一系列决策节点。每一个决策节点都是一个问题,然后可以根据这个问题把数据分成两个或多个子节点。这个数一直往下创建,知道最终所有的数据都属于一个类。创建一个最佳决策的标准就是信息增益。下图就是一个简单的决策树示意图:
使用决策树分类器来train机器学习model就是找到决策树的边界。
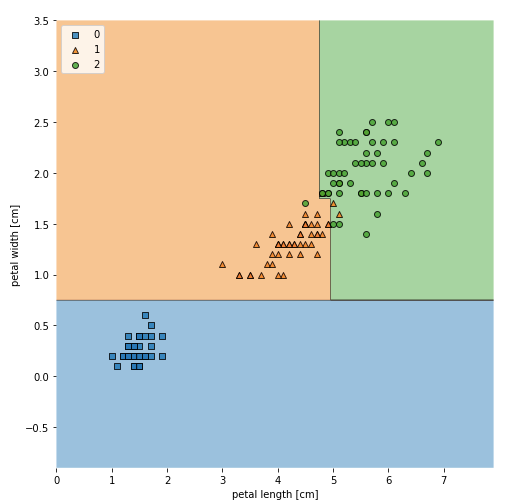
通过把feature空间分成多个长方形,决策树可以创建很多复杂的决策边界。下面就是我们使用决策树分类器来训练Sklearn IRIS数据的决策边界示意图。feature空间分别由petal length和petal width组成,后面我们会给出详细的代码:
决策树代码示例
下面就是一个示例代码:
import pandas as pd
import numpy as np
import matplotlib.pyplot as plt
from sklearn import datasets
from sklearn.model_selection import train_test_split
from sklearn.tree import DecisionTreeClassifier

iris = datasets.load_iris()

X = iris.data[:, 2:]
y = iris.target

X_train, X_test, y_train, y_test = train_test_split(X, y, test_size=0.3, random_state=1, stratify=y)
clf_tree = DecisionTreeClassifier(criterion='gini', max_depth=4, random_state=1)
clf_tree.fit(X_train, y_train)
图形化决策树Model决策边界
下面这个代码可以用来创建上面显示的决策边界图,我们需要install mlxtend这个包:
from mlxtend.plotting import plot_decision_regions
X_combined = np.vstack((X_train, X_test))
y_combined = np.hstack((y_train, y_test))
fig, ax = plt.subplots(figsize=(7, 7))
plot_decision_regions(X_combined, y_combined, clf=clf_tree)
plt.xlabel('petal length [cm]')
plt.ylabel('petal width [cm]')
plt.legend(loc='upper left')
plt.tight_layout()
plt.show()
以树的结构来显示决策树
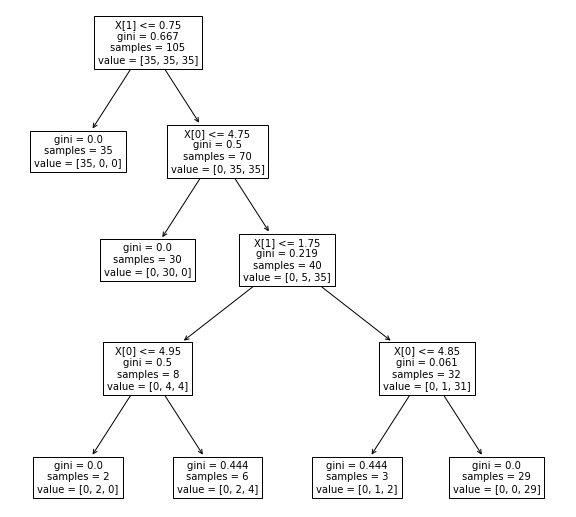
下面是用数的结构来显示结果,我们会使用sklearn tree类中的plot_tree函数,代码如下:
from sklearn import tree
fig, ax = plt.subplots(figsize=(10, 10))
tree.plot_tree(clf_tree, fontsize=10)
plt.show()
下图就是上面代码显示的结果,注意我们要用plt.subplots(figsize=(10, 10))来让图形大一点,否则显示的图片很小:
好了,简单的Python实现的决策树分类器就介绍到这里了。
参考文章:https://dzone.com/articles/decision-tree-classifier-python-code-example-reski


Recent Comments